Basisstatistiken
| Institutionelle Eigentümer | 119 total, 114 long only, 1 short only, 4 long/short - change of -11,24% MRQ |
| Durchschnittliche Portfolioallokation | 0.4462 % - change of 26,61% MRQ |
| Institutionelle Aktien (Long) | 4.951.555 (ex 13D/G) - change of -1,31MM shares -11,13% MRQ |
| Institutioneller Wert (Long) | $ 334.031 USD ($1000) |
Institutioneller Eigentümerschaft und Aktionäre
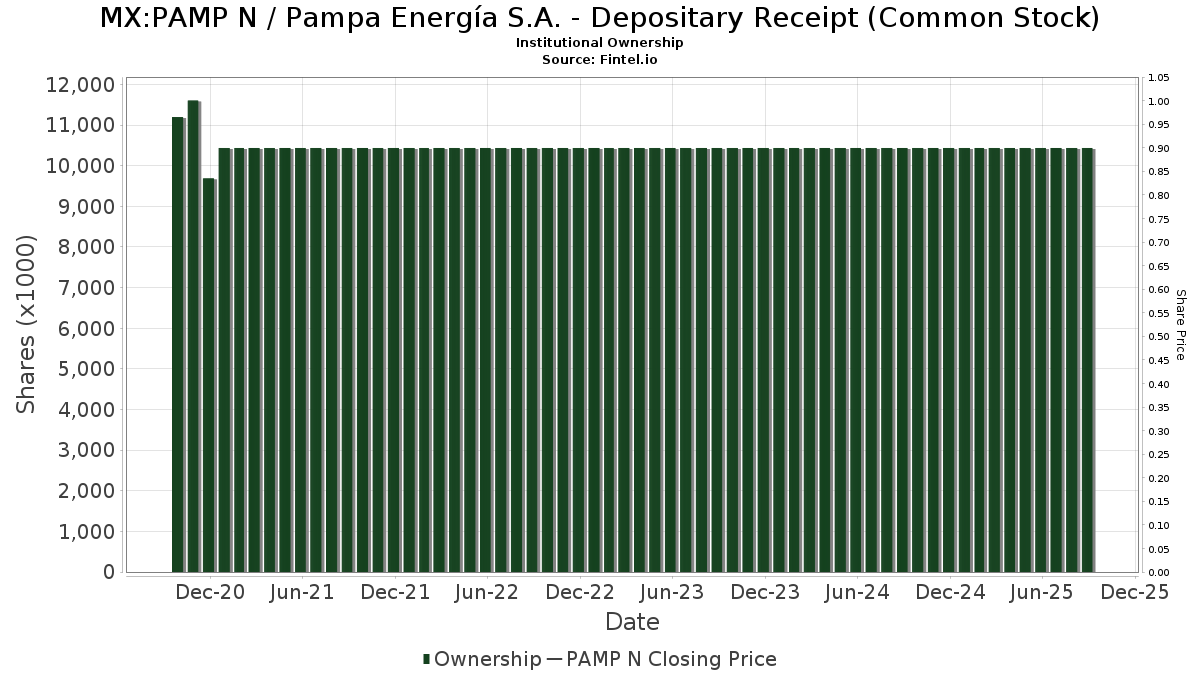
Pampa Energía S.A. - Depositary Receipt (Common Stock) (MX:PAMP N) hat 119 institutionelle Eigentümer und Aktionäre, die 13D/G oder 13F Formulare bei der Securities Exchange Commission (SEC) eingereicht haben. Diese Institutionen halten insgesamt 4,952,153 Aktien. Die größten Aktionäre sind TT International Asset Management LTD, MIRAE ASSET GLOBAL ETFS HOLDINGS Ltd., ARGT - Global X MSCI Argentina ETF, Helikon Investments Ltd, Millennium Management Llc, Jpmorgan Chase & Co, Itau Unibanco Holding S.A., VR Advisory Services Ltd, Morgan Stanley, and Voloridge Investment Management, Llc .
Pampa Energía S.A. - Depositary Receipt (Common Stock) (BMV:PAMP N) Die institutionelle Eigentümerstruktur zeigt die aktuellen Positionen von Institutionen und Fonds im Unternehmen sowie die jüngsten Veränderungen der Positionsgröße. Zu den Großaktionären können Einzelanleger, Investmentfonds, Hedgefonds oder Institutionen gehören. Der Schedule 13D zeigt an, dass der Investor mehr als 5% des Unternehmens hält (oder gehalten hat) und beabsichtigt (oder beabsichtigt hat), aktiv eine Änderung der Geschäftsstrategie zu verfolgen. Schedule 13G zeigt eine passive Investition von über 5% an.
Fondsstimmung-Score
Der Fondsstimmung-Score (auch bekannt als Eigentümer-Akkumulations-Score) ermittelt die Aktien, die am meisten von Fonds gekauft werden. Er ist das Ergebnis eines ausgeklügelten quantitativen Multifaktormodells, das die Unternehmen mit den höchsten institutionellen Käufen identifiziert. Das Scoring-Modell verwendet eine Kombination aus der Gesamtzunahme der offengelegten Eigentümer, den Änderungen der Portfolioallokationen in diesen Eigentümern und anderen Metriken. Die Zahl reicht von 0 bis 100, wobei höhere Zahlen ein höheres Maß an Kapitalakkumulation als bei anderen Unternehmen anzeigen und 50 den Durchschnitt darstellt.
Aktualisierungshäufigkeit: Täglich
Siehe Ownership Explorer, der eine Liste der am höchsten bewerteten Unternehmen enthält.
AI+ Ask Fintel’s AI assistant about Pampa Energía S.A. - Depositary Receipt (Common Stock).
Select a question to share a public post with an AI-crafted answer.
Thinking of good questions…
13F und NPORT Einreichungen
Details zu 13F-Einreichungen sind kostenlos. Für Details zu NP-Einreichungen ist eine Premium-Mitgliedschaft erforderlich. Grüne Zeilen zeigen neue Positionen an. Rote Zeilen zeigen geschlossene Positionen an. Klicken Sie auf das Link Symbol, um den gesamten Transaktionsverlauf zu sehen.
Upgrade
um Prämiendaten freizuschalten und nach Excel zu exportieren ![]() .
.
| Datei Datum | Quelle | Anleger | Typ | Durchschnittlicher Preis (Est) |
Aktien | Δ Aktien (%) |
Gemeldeter Wert ($1000) |
Δ Wert (%) |
Port Alloc (%) |
|
|---|---|---|---|---|---|---|---|---|---|---|
| 2025-05-30 | NP | Highland Global Allocation Fund | 67.700 | 0,00 | 5.226 | -12,21 | ||||
| 2025-08-26 | NP | DRESX - Driehaus Emerging Markets Small Cap Growth Fund | 21.253 | 17,44 | 1.475 | 5,51 | ||||
| 2025-10-22 | 13F | Financial Perspectives, Inc | 114 | 0,00 | 7 | -14,29 | ||||
| 2025-10-27 | 13F | Decker Retirement Planning Inc. | 0 | -100,00 | 0 | |||||
| 2025-08-13 | 13F | Townsquare Capital Llc | 0 | -100,00 | 0 | |||||
| 2025-08-14 | 13F | D. E. Shaw & Co., Inc. | 3.168 | -23,20 | 220 | -31,13 | ||||
| 2025-05-14 | 13F | First Trust Advisors Lp | 0 | -100,00 | 0 | |||||
| 2025-08-11 | 13F | Principal Securities, Inc. | 11 | 1 | ||||||
| 2025-05-09 | 13F | Headlands Technologies LLC | 0 | -100,00 | 0 | |||||
| 2025-07-29 | 13F | William Blair Investment Management, Llc | 89.640 | 6,47 | 6.219 | -4,31 | ||||
| 2025-07-29 | 13F | Beverly Hills Private Wealth, LLC | 3.731 | -6,89 | 259 | -16,50 | ||||
| 2025-06-24 | NP | JEMA - JPMorgan Emerging Markets Equity Core ETF | 0 | -100,00 | 0 | -100,00 | ||||
| 2025-08-14 | 13F | Driehaus Capital Management Llc | 21.253 | 17,44 | 1.475 | 5,51 | ||||
| 2025-05-14 | 13F | Candriam Luxembourg S.C.A. | 0 | -100,00 | 0 | |||||
| 2025-08-25 | NP | AADR - AdvisorShares Dorsey Wright ADR ETF | 20.740 | 19,95 | 1.439 | 7,80 | ||||
| 2025-05-16 | 13F | Arete Wealth Advisors, LLC | 0 | -100,00 | 0 | |||||
| 2025-08-13 | 13F | Centiva Capital, LP | 3.331 | 231 | ||||||
| 2025-10-16 | 13F | Ronald Blue Trust, Inc. | 6 | 0,00 | 0 | |||||
| 2025-06-02 | 13F/A | Deutsche Bank Ag\ | 0 | -100,00 | 0 | |||||
| 2025-08-04 | 13F | AdvisorShares Investments LLC | 20.740 | 19,95 | 1.439 | 5,66 | ||||
| 2025-08-14 | 13F | Jane Street Group, Llc | 17.665 | -9,90 | 1.226 | -19,04 | ||||
| 2025-08-14 | 13F | Bnp Paribas Arbitrage, Sa | 12.382 | -82,70 | 859 | -84,45 | ||||
| 2025-05-08 | NP | QGBLX - Quantified Global Fund Investor Class | 730 | 158,87 | 56 | 133,33 | ||||
| 2025-08-14 | 13F | Cubist Systematic Strategies, LLC | 58.577 | 30,69 | 4.064 | 17,46 | ||||
| 2025-08-14 | 13F | Qube Research & Technologies Ltd | 5.456 | 379 | ||||||
| 2025-09-24 | NP | EAEMX - Parametric Emerging Markets Fund Investor Class | 1.829 | 0,00 | 139 | 7,75 | ||||
| 2025-08-08 | 13F | Pnc Financial Services Group, Inc. | 10 | 25,00 | 1 | |||||
| 2025-10-02 | 13F | GAMMA Investing LLC | 1.947 | -8,76 | 117 | -21,62 | ||||
| 2025-08-12 | 13F | EAM Global Investors LLC | 0 | -100,00 | 0 | |||||
| 2025-08-25 | NP | EITEX - Parametric Tax-Managed Emerging Markets Fund Institutional Class | 6.575 | 0,00 | 456 | -10,06 | ||||
| 2025-08-01 | 13F | Banco Santander, S.A. | 4.248 | 48,12 | 295 | 33,03 | ||||
| 2025-08-13 | 13F | Quantbot Technologies LP | 0 | -100,00 | 0 | |||||
| 2025-08-27 | NP | IEMSX - ABS Insights Emerging Markets Fund Super Institutional Class Shares | 3.300 | 0,00 | 229 | -10,24 | ||||
| 2025-09-26 | NP | UBPIX - Ultralatin America Profund Investor Class | 655 | 14,11 | 50 | 22,50 | ||||
| 2025-08-27 | NP | TIFF INVESTMENT PROGRAM - TIFF Multi-Asset Fund | Short | -598 | -41 | |||||
| 2025-05-15 | 13F | Compass Group Llc | 0 | -100,00 | 0 | |||||
| 2025-08-11 | 13F | Fore Capital, LLC | 3.000 | 208 | ||||||
| 2025-08-14 | 13F | Bank Of America Corp /de/ | 17.279 | -32,97 | 1.199 | -39,77 | ||||
| 2025-08-14 | 13F | Susquehanna International Group, Llp | Put | 10.300 | -45,50 | 715 | -51,06 | |||
| 2025-08-14 | 13F | Susquehanna International Group, Llp | 11.755 | -37,17 | 816 | -43,56 | ||||
| 2025-08-14 | 13F | Susquehanna International Group, Llp | Call | 26.100 | 64,15 | 1.811 | 47,51 | |||
| 2025-10-09 | 13F | ABS Direct Equity Fund LLC | 23.350 | -6,80 | 1.402 | -19,33 | ||||
| 2025-10-09 | 13F | Toth Financial Advisory Corp | 100 | 0,00 | 6 | 0,00 | ||||
| 2025-08-14 | 13F | Diversify Wealth Management, Llc | 23.221 | 14,41 | 1.767 | 18,36 | ||||
| 2025-10-21 | 13F | Titan Global Capital Management Usa Llc | 8.872 | -4,35 | 533 | -17,26 | ||||
| 2025-08-08 | 13F | Alberta Investment Management Corp | 0 | -100,00 | 0 | |||||
| 2025-08-14 | 13F | Ameriprise Financial Inc | 0 | -100,00 | 0 | |||||
| 2025-07-14 | 13F | Ridgewood Investments LLC | 100 | 0,00 | 7 | -14,29 | ||||
| 2025-08-14 | 13F | Federation des caisses Desjardins du Quebec | 200 | 0,00 | 14 | -13,33 | ||||
| 2025-10-02 | 13F | TT International Asset Management LTD | 821.300 | -25,50 | 49.327 | -35,51 | ||||
| 2025-08-06 | 13F | First Horizon Advisors, Inc. | 742 | 51 | ||||||
| 2025-10-15 | 13F | Cwm, Llc | 0 | -100,00 | 0 | |||||
| 2025-08-20 | NP | WXCIX - William Blair Emerging Markets ex China Growth Fund Class I | 2.750 | -0,25 | 191 | -10,38 | ||||
| 2025-07-21 | 13F | Ping Capital Management, Inc. | 76.200 | 74,90 | 5.287 | 57,18 | ||||
| 2025-10-29 | 13F | Yorktown Management & Research Co Inc | 12.900 | 0,00 | 775 | -13,52 | ||||
| 2025-08-14 | 13F | Sunbelt Securities, Inc. | 60 | 0,00 | 5 | 25,00 | ||||
| 2025-08-14 | 13F | Royal Bank Of Canada | 736 | -13,82 | 51 | -21,54 | ||||
| 2025-10-20 | 13F | Shilanski & Associates, Inc. | 0 | -100,00 | 0 | |||||
| 2025-08-14 | 13F | Turim 21 Investimentos Ltda. | 10.916 | 0,00 | 757 | -10,10 | ||||
| 2025-05-16 | 13F | Jones Financial Companies Lllp | 0 | -100,00 | 0 | |||||
| 2025-08-08 | 13F | Wrapmanager Inc | 3.135 | -2,37 | 218 | -12,15 | ||||
| 2025-08-14 | 13F | Aquatic Capital Management LLC | 11.050 | -25,69 | 767 | -33,28 | ||||
| 2025-08-14 | 13F | Two Sigma Investments, Lp | 0 | -100,00 | 0 | |||||
| 2025-08-14 | 13F | Citadel Advisors Llc | Put | 16.600 | 0,00 | 1.152 | -10,15 | |||
| 2025-08-14 | 13F | LWM Advisory Services, LLC | 4.373 | -17,35 | 303 | -25,74 | ||||
| 2025-07-18 | 13F | Truist Financial Corp | 18.895 | 0,21 | 1.311 | -9,97 | ||||
| 2025-07-18 | 13F | PFG Investments, LLC | 4.275 | 297 | ||||||
| 2025-07-29 | 13F | Stratos Wealth Partners, LTD. | 0 | -100,00 | 0 | |||||
| 2025-08-14 | 13F | Citadel Advisors Llc | Call | 6.200 | -32,61 | 430 | -39,44 | |||
| 2025-08-14 | 13F/A | Barclays Plc | 380 | 0 | ||||||
| 2025-08-14 | 13F | Citadel Advisors Llc | 4.958 | -56,84 | 344 | -61,29 | ||||
| 2025-06-11 | NP | SLANX - DWS Latin America Equity Fund Class A | 25.521 | 35,79 | 1.812 | 7,80 | ||||
| 2025-08-12 | 13F | Insigneo Advisory Services, Llc | 10.186 | 15,03 | 707 | 3,37 | ||||
| 2025-05-15 | 13F | Hood River Capital Management LLC | 0 | -100,00 | 0 | |||||
| 2025-08-11 | 13F | Citigroup Inc | 349 | -22,44 | 24 | -29,41 | ||||
| 2025-08-11 | 13F | Absolute Gestao de Investimentos Ltda. | 41.547 | 2.883 | ||||||
| 2025-08-05 | 13F | Simplex Trading, Llc | Put | 300 | 0 | |||||
| 2025-07-22 | NP | IHIAX - Federated Emerging Market Debt Fund Class A Shares This fund is a listed as child fund of Federated Hermes, Inc. and if that institution has disclosed ownership in this security, then these positions will not be double counted when calculating total shares and total value | 183 | 14 | ||||||
| 2025-08-05 | 13F | Simplex Trading, Llc | Call | 200 | 100,00 | 0 | ||||
| 2025-08-15 | 13F | Tower Research Capital LLC (TRC) | 66 | 5 | ||||||
| 2025-05-14 | 13F | Flow Traders U.s. Llc | 0 | -100,00 | 0 | |||||
| 2025-07-22 | 13F | Gsa Capital Partners Llp | 3.615 | 0 | ||||||
| 2025-08-27 | 13F/A | Squarepoint Ops LLC | 5.777 | 77,15 | 401 | 59,36 | ||||
| 2025-08-14 | 13F | Mml Investors Services, Llc | 14.156 | 1 | ||||||
| 2025-08-14 | 13F | Point72 Asset Management, L.P. | 22.200 | -72,42 | 1.540 | -75,21 | ||||
| 2025-05-15 | 13F | Oaktree Capital Management Lp | 0 | -100,00 | 0 | |||||
| 2025-09-04 | 13F/A | Advisor Group Holdings, Inc. | 3.413 | -1,67 | 237 | -11,61 | ||||
| 2025-08-08 | 13F | SBI Securities Co., Ltd. | 127 | 0,79 | 9 | -11,11 | ||||
| 2025-08-14 | 13F | D. E. Shaw & Co., Inc. | Call | 0 | -100,00 | 0 | -100,00 | |||
| 2025-09-26 | NP | Global Macro Capital Opportunities Portfolio - Global Macro Capital Opportunities Portfolio | 61.669 | 12,39 | 4.690 | 20,39 | ||||
| 2025-08-14 | 13F | Two Sigma Advisers, Lp | 3.000 | -69,39 | 208 | -72,49 | ||||
| 2025-08-14 | 13F | Goldman Sachs Group Inc | 11.176 | 53,77 | 775 | 38,15 | ||||
| 2025-09-29 | NP | APITX - Yorktown Growth Fund Class L Shares | 12.900 | 0,00 | 981 | 7,21 | ||||
| 2025-08-14 | 13F | Voloridge Investment Management, Llc | 118.614 | -28,72 | 8.229 | -35,95 | ||||
| 2025-08-14 | 13F | GWM Advisors LLC | 287 | 0,00 | 20 | -13,64 | ||||
| 2025-05-14 | 13F | Jump Financial, LLC | 0 | -100,00 | 0 | |||||
| 2025-10-17 | 13F | Chesapeake Asset Management Llc | 11.202 | 0,00 | 673 | -13,51 | ||||
| 2025-07-23 | 13F | Ameliora Wealth Management Ltd. | 0 | -100,00 | 0 | |||||
| 2025-08-12 | 13F | Jpmorgan Chase & Co | 317.998 | -9,49 | 22.063 | -18,66 | ||||
| 2025-08-14 | 13F | Verition Fund Management LLC | 19.036 | 1.321 | ||||||
| 2025-08-14 | 13F | Group One Trading, L.p. | Call | 0 | -100,00 | 0 | -100,00 | |||
| 2025-08-13 | 13F | Federated Hermes, Inc. | 8.337 | 578 | ||||||
| 2025-08-14 | 13F | Toroso Investments, LLC | 0 | -100,00 | 0 | |||||
| 2025-10-27 | 13F | Janney Montgomery Scott LLC | 7.983 | -2,29 | 0 | |||||
| 2025-08-13 | 13F | EverSource Wealth Advisors, LLC | 892 | -5,11 | 62 | -15,28 | ||||
| 2025-08-08 | 13F | Helikon Investments Ltd | 492.578 | 0,00 | 34.175 | -10,13 | ||||
| 2025-08-14 | 13F | Banco BTG Pactual S.A. | 93.583 | 467,17 | 6.493 | 409,98 | ||||
| 2025-08-14 | 13F | Stifel Financial Corp | 11.114 | -0,13 | 771 | -10,24 | ||||
| 2025-08-13 | 13F | Northern Trust Corp | 6.758 | 10,46 | 469 | -0,85 | ||||
| 2025-08-14 | 13F | Diversify Advisory Services, LLC | 7.172 | 23,25 | 546 | 27,63 | ||||
| 2025-08-13 | 13F | Marshall Wace, Llp | 57.153 | 21,71 | 3.965 | 9,38 | ||||
| 2025-08-14 | 13F | Brevan Howard Capital Management LP | 38.803 | 2.768 | ||||||
| 2025-08-11 | 13F | Dorsey Wright & Associates | 29.907 | -38,67 | 2.075 | -44,89 | ||||
| 2025-05-30 | NP | EHLS - Even Herd Long Short ETF | 2.819 | -42,40 | 218 | -49,53 | ||||
| 2025-05-15 | 13F | Old Mission Capital Llc | 0 | -100,00 | 0 | -100,00 | ||||
| 2025-10-14 | 13F | Farther Finance Advisors, LLC | 91 | -50,54 | 5 | -58,33 | ||||
| 2025-08-14 | 13F | Raymond James Financial Inc | 532 | 37 | ||||||
| 2025-10-24 | 13F | ORG Wealth Partners, LLC | 0 | -100,00 | 0 | |||||
| 2025-08-14 | 13F | Seldon Capital Lp | 0 | -100,00 | 0 | |||||
| 2025-08-14 | 13F | Glenorchy Capital Ltd | 70.039 | -2,09 | 4.859 | -12,01 | ||||
| 2025-08-12 | 13F | Rhumbline Advisers | 44 | 0,00 | 3 | 0,00 | ||||
| 2025-08-14 | 13F | Hrt Financial Lp | 4.422 | -4,41 | 0 | |||||
| 2025-05-15 | 13F | Two Sigma Securities, Llc | 0 | -100,00 | 0 | |||||
| 2025-08-12 | 13F | LPL Financial LLC | 15.082 | 124,43 | 1.046 | 101,93 | ||||
| 2025-08-14 | 13F | Integrated Wealth Concepts LLC | 4.807 | 334 | ||||||
| 2025-10-23 | 13F | Spire Wealth Management | 42 | 0,00 | 3 | 0,00 | ||||
| 2025-07-30 | 13F | Whittier Trust Co | 23.229 | 10,52 | 1.612 | -0,68 | ||||
| 2025-08-05 | 13F | Advisors Preferred, LLC | 0 | -100,00 | 0 | |||||
| 2025-07-14 | 13F | UMA Financial Services, Inc. | 1 | 0,00 | 0 | |||||
| 2025-05-14 | 13F | Credit Agricole S A | 920 | 0,00 | 71 | -11,25 | ||||
| 2025-10-16 | 13F | Burns Matteson Capital Management, LLC | 0 | -100,00 | 0 | |||||
| 2025-08-13 | 13F | Pictet Asset Management Holding SA | 15.301 | 146,71 | 1.062 | 121,97 | ||||
| 2025-08-05 | 13F | Claro Advisors LLC | 0 | -100,00 | 0 | |||||
| 2025-08-14 | 13F | Group One Trading, L.p. | Put | 5.000 | 0,00 | 347 | -10,36 | |||
| 2025-08-14 | 13F | Balyasny Asset Management Llc | 103.216 | 11,57 | 7.161 | 0,27 | ||||
| 2025-08-14 | 13F | Millennium Management Llc | 359.769 | 121,37 | 24.961 | 98,95 | ||||
| 2025-08-13 | 13F | Hsbc Holdings Plc | 25.049 | -29,54 | 1.766 | -35,91 | ||||
| 2025-08-14 | 13F | Group One Trading, L.p. | 973 | 68 | ||||||
| 2025-08-14 | 13F | UBS Group AG | 34.293 | 88,23 | 2.379 | 69,20 | ||||
| 2025-07-21 | 13F | Mirae Asset Global Investments Co., Ltd. | 562 | 8,29 | 39 | -5,00 | ||||
| 2025-08-15 | 13F | Morgan Stanley | 142.268 | 18,87 | 9.871 | 6,83 | ||||
| 2025-08-14 | 13F | Wells Fargo & Company/mn | 167 | -71,45 | 12 | -75,56 | ||||
| 2025-08-19 | 13F | Marex Group plc | 20.885 | 1.449 | ||||||
| 2025-05-13 | 13F | Wellington Management Group Llp | 0 | -100,00 | 0 | -100,00 | ||||
| 2025-08-12 | 13F | Proequities, Inc. | Put | 0 | 0 | |||||
| 2025-08-12 | 13F | Proequities, Inc. | Call | 0 | 0 | |||||
| 2025-08-12 | 13F | Proequities, Inc. | 0 | 0 | ||||||
| 2025-07-11 | 13F | Assenagon Asset Management S.A. | 0 | -100,00 | 0 | |||||
| 2025-08-01 | 13F | Envestnet Asset Management Inc | 30.306 | 18,17 | 2.103 | 6,22 | ||||
| 2025-05-15 | 13F | BTG Pactual Asset Management US LLC | 0 | -100,00 | 0 | |||||
| 2025-08-07 | 13F | Acadian Asset Management Llc | 7.969 | -47,15 | 1 | -100,00 | ||||
| 2025-08-14 | 13F | Barometer Capital Management Inc. | 5.900 | 31,11 | 409 | 17,87 | ||||
| 2025-08-12 | 13F | Personal Cfo Solutions, Llc | 4.335 | 6,80 | 301 | -4,15 | ||||
| 2025-07-31 | 13F | Caitong International Asset Management Co., Ltd | 55 | 111,54 | 4 | 50,00 | ||||
| 2025-05-15 | 13F | Discovery Capital Management, Llc / Ct | 0 | -100,00 | 0 | -100,00 | ||||
| 2025-07-08 | 13F | Northwest & Ethical Investments L.P. | 0 | -100,00 | 0 | -100,00 | ||||
| 2025-10-24 | 13F | Deltec Asset Management Llc | 5.000 | 66,67 | 300 | 44,23 | ||||
| 2025-08-04 | 13F | Atria Investments Llc | 7.224 | 0,33 | 501 | -9,73 | ||||
| 2025-08-12 | 13F | Virtu Financial LLC | 0 | -100,00 | 0 | |||||
| 2025-08-14 | 13F | Highland Capital Management Fund Advisors, L.p. | 0 | -100,00 | 0 | |||||
| 2025-07-30 | NP | APIE - ActivePassive International Equity ETF | 5.761 | -25,39 | 442 | -25,63 | ||||
| 2025-09-23 | NP | FEDERATED CORE TRUST - Emerging Markets Core Fund This fund is a listed as child fund of Federated Hermes, Inc. and if that institution has disclosed ownership in this security, then these positions will not be double counted when calculating total shares and total value | 8.154 | 620 | ||||||
| 2025-09-29 | NP | ARGT - Global X MSCI Argentina ETF This fund is a listed as child fund of Mirae Asset Global Investments Co., Ltd. and if that institution has disclosed ownership in this security, then these positions will not be double counted when calculating total shares and total value | 556.923 | 0,84 | 42.354 | 8,02 | ||||
| 2025-08-08 | 13F | Itau Unibanco Holding S.A. | 304.174 | 42,35 | 21.104 | 131.793,75 | ||||
| 2025-05-09 | 13F | R Squared Ltd | 0 | -100,00 | 0 | |||||
| 2025-07-30 | 13F | Whittier Trust Co Of Nevada Inc | 10.690 | 51,76 | 742 | 36,46 | ||||
| 2025-08-14 | 13F | Jain Global LLC | 0 | -100,00 | 0 | |||||
| 2025-08-14 | 13F | VR Advisory Services Ltd | 272.013 | 0,00 | 18.872 | -10,13 | ||||
| 2025-08-14 | 13F | MIRAE ASSET GLOBAL ETFS HOLDINGS Ltd. | 603.127 | 8,19 | 41.845 | -2,77 | ||||
| 2025-08-08 | 13F | Cetera Investment Advisers | 7.763 | -2,76 | 539 | -12,66 |